ProfileR version 2.5 October 2003
ProfileR has been designed for surface array resistivity profile imaging; providing an inverse program for a 2-D resistivity distribution based on computation of 3-D current flow using a quadrilateral finite element mesh. The inverse solution is based on a regularised objective function combined with weighted least squares (an 'Occams' type solution). The code supplied has been compiled for Intel compatible processors, users working on different platforms should contact the author.
 ProfileR requires very little input for generation of the finite element mesh. It is a 'cut down' version of the generalised 2D inverse code R2. The minimum the user must specify is the number of electrodes and the co-ordinates of the end electrodes. ProfileR can account for variation in topography by user specification of position of intermediate electrode positions and elevation. The spacing of electrodes does not need to be uniform.
The mesh that is generated consists of a foreground region and a background region. The foreground region is the area investigated by the survey and it will be the resistivity variation in this area that will be output by ProfileR. The background region is transparent to the user and is employed to account for the infinite boundary conditions. The mesh is generated with two finite elements between electrodes in the horizontal in the foreground region. In the background region the mesh is extended to the left and right of the electrode array using exponentially increasing elements. In the vertical elements increase in size with depth. The region is parameterised in terms of resistivity blocks by grouping patches of elements. In the foreground region a parameter block is defined as a 2 by 2 block of elements.
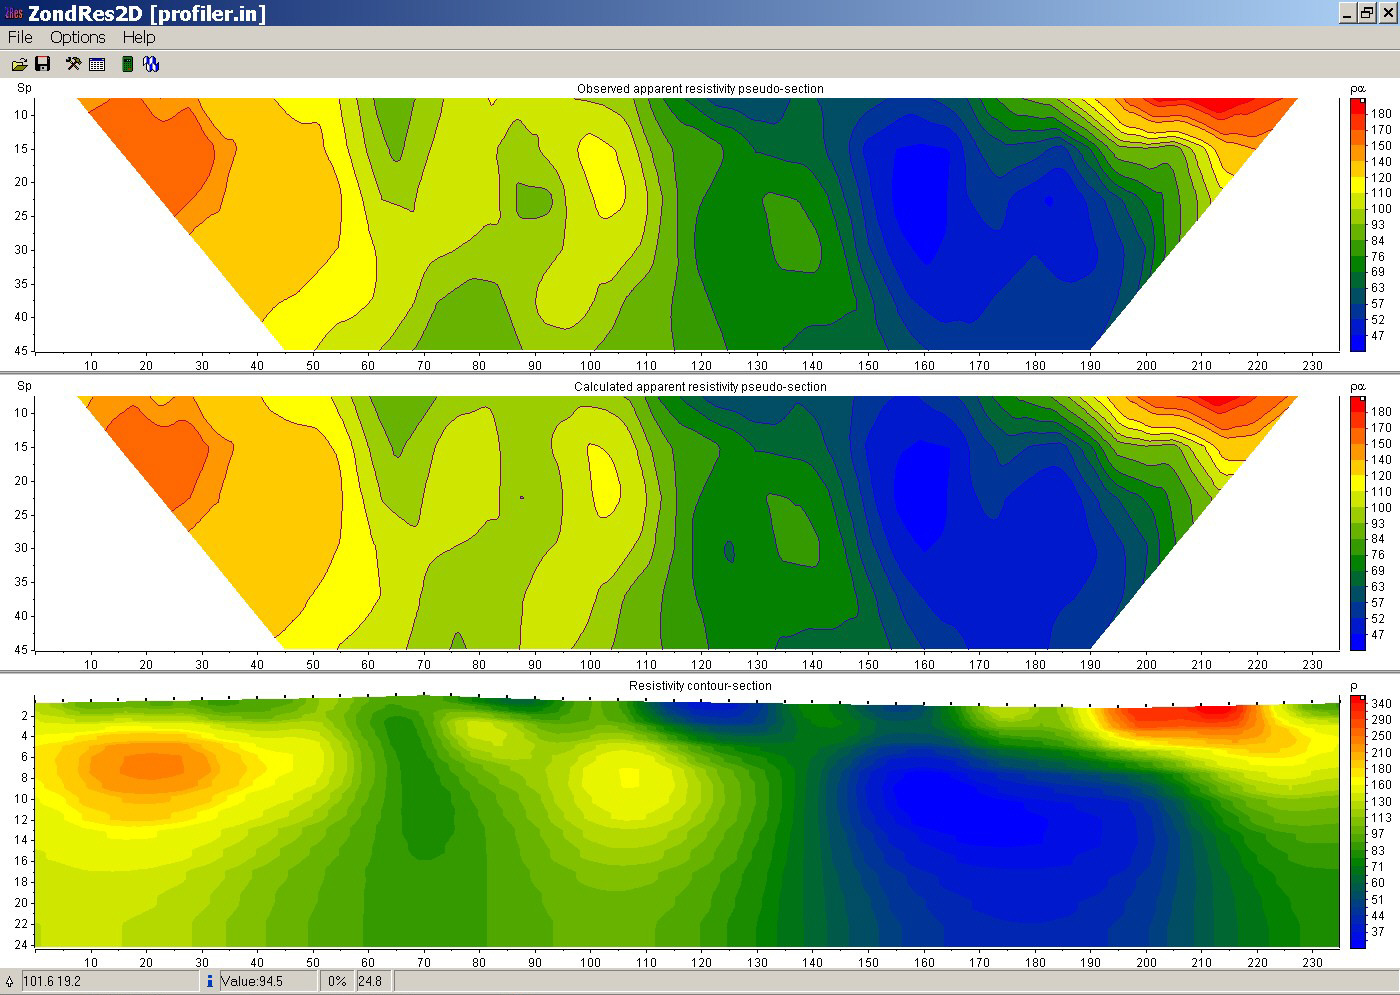 ProfileR has no built in graphical interface. The user can use his/her own software for graphical output (e.g. Surfer). Alternatively the interface Zondres2D written by Alexander Kaminsky can be used. This is attached in the download bundle along with a readme file to explain how to get started.
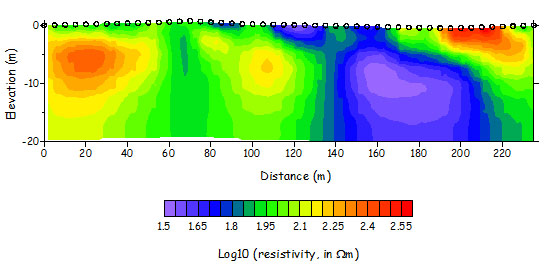
The plot shown here is an example of the output from the Zondres2D graphical interface written for ProfileR by Alexander Kaminsky
ProfileR has no built in graphical interface. The user can use his/her own software for graphical output (e.g. Surfer). Alternatively the interface Zondres2D written by Alexander Kaminsky can be used. This is attached in the download bundle along with a readme file to explain how to get started.
The plot shown here is an example of the output from the Zondres2D graphical interface written for ProfileR by Alexander Kaminsky
Download ProfileR
Note that there is no installation script to run. The ProfileR executable should be copied to a working folder and run from there. Examples are provided (see download below).User guide (pdf)
Download ProfileR program and guide ( .rar file)