The system (supplied by M & P Survey Equipment Ltd of Chester in liaison with Nick Chappell of Lancaster University) comprises of a Total Station, a three-tripod traversing kit, a logging system and the trigonomic analysis / mapping software. A Total Station is an apparatus that combines (i) a theodolite with electronic tacheometers for vertical and horizontal angular measurement and (ii) an Electromagnetic Distance Measurement (EDM) for distance measurement. The EDM incorporated into the Total Station purchased (Leica TC400) uses a laser to transmit an infra-red, frequency modulated signal on a THz carrier wave to a retro-directive prism which returns the signal. The phase difference between the transmitted and received signal is then used to calculate the slope distance using:
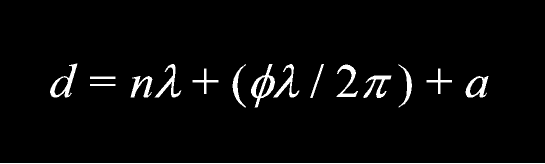
where d is the double distance, i.e., total travel of wave, l is the modulation wavelength (i.e., Vo/m f), n is the number of complete wavelengths within d, f is the phase difference between the outgoing and incoming signals, a is an additive constant related to geometrical and electrical eccentricities, Vo is the velocity of the electromagnetic wave in vacuo, m is the refractive index and f is the frequency. Within our system a Psion XP datalogger fitted with Leicapak software and a 32K RAM is used to record these slope distance readings together with measurements of vertical and horizontal angle and site/control attributes. A Microsoft Windows programme - LISCAD is maintained on two Royal Society computers at the DVFC for the subsequent trigonomic analysis and mapping of these data.
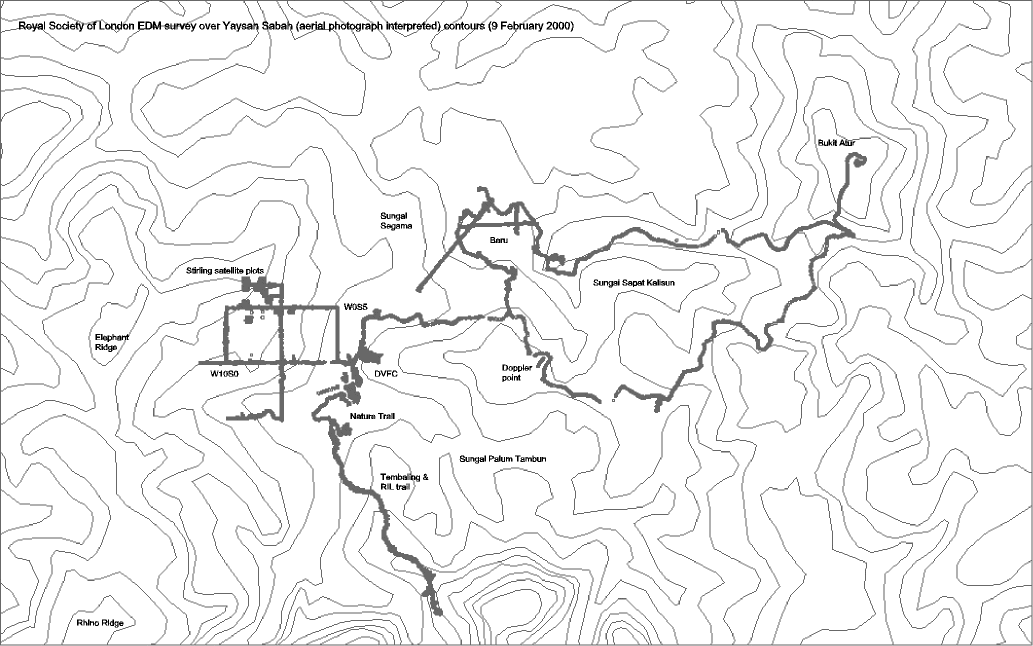
The 6 km square Lembah Danum research area has limited line-of-sight due the dense forest cover and undulating terrain. The most appropriate method of control surveying under such conditions is that of traversing. Under this method a framework of control stations where each station is intervisible with at least two other stations is established over the region to be surveyed. The lines joining these stations are the traverse lines. The survey then consists of the measurement of (i) angles between successive traverses (bearings), and (ii) the length of each traverse. Given the co-ordinates of the first station and the bearing of the first line, the co-ordinates of all successive points can be calculated. If the survey of this framework is undertaken in loops starting and finishing at the same co-ordinate then it is called a closed loop traverse and the errors can be calculated and corrected. The overall accuracy of final map is dependent on very precise surveying (± a few millimetres) of the control stations. To achieve this traversing systems require (i) three tripods each fitted with forced centring equipment (tribrachs) for the Total Station and prism assemblies, and (ii) a Total Station incorporating a liquid compensator to correct for minor tilts.
As we need to undertake the Lembah Danum survey in stages and add further detail in certain areas, then fixed ground markers need to be installed. For Danum, painted Belian (Eusioderoxylon zwageri) spikes (2" x 2" x 12") are used for these markers. Surveying the topography in the vicinity of each control station is achieved to a lower degree of accuracy using a detail pole within a method of radiation surveying. This radiation surveying is undertaken considerably quicker with a datalogged Total Station than with traditional non-electronic methods.