| | ENV 104 | ||||||
|
| | ENV 104 | ||||||
|
|
Field exercise:
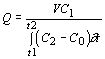
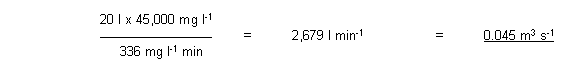
Dilution methods of stream or cave-water gauging are based on dilution of a known volume and concentration of a tracer when applied to the flow. Measurements of the cross-sectional area of the channel are, therefore, not required. Several tracers are suitable for dilution gauging - sodium chloride and fluorescent dyes for example, can be monitored in situ using a conductivity meter and fluorometer respectively. The integration method differs from the constant-rate method of dilution gauging in that the tracer is added to the stream in bulk (i.e., as a single 'gulp'). The most accurate procedure for calculating the discharge is then based on the ratio of the input tracer load (VC1) to the mixed concentration at the downstream location (less the background concentration):
where Q is the river discharge (cubic metres per second or 'cumecs'), V is the volume of tracer added (cubic metres), C0 is the background concentration in the river, C1 is the tracer input concentration, and C2 is the concentration at the downstream sampling station at time t. The denominator is the area beneath the chemograph, and can be calculated by counting squares or using the trapezium rule, i.e.,
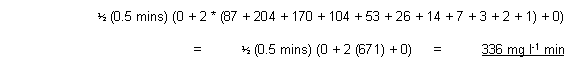
where X is the length of each time increment, C is the concentration (or conductivity, i.e., C2 - C0) following each time increment, and N is the number of measurements. Minimum requirements:
2. The reach must be sufficiently long and turbulent to allow good mixing of the tracer with the river-flow.
One group should locate a conductivity meter in the channel flow (Figure 5) (NB avoiding areas of extreme cavitation), and record the background conductivity on a worksheet ~ see below. 
Figure 5.
A second group should select a injection point some 30 to 40 m upstream of the monitoring station. At this point they should fill two 10 litre buckets � full of stream-water and gradually dissolve 450 g sodium chloride into each (Figure 6). Once the NaCl is dissolved, further water should be added to fill the bucket to the 10 litre mark. If channel discharges are high, the test may require four buckets (each with 450 g NaCl) to be added. 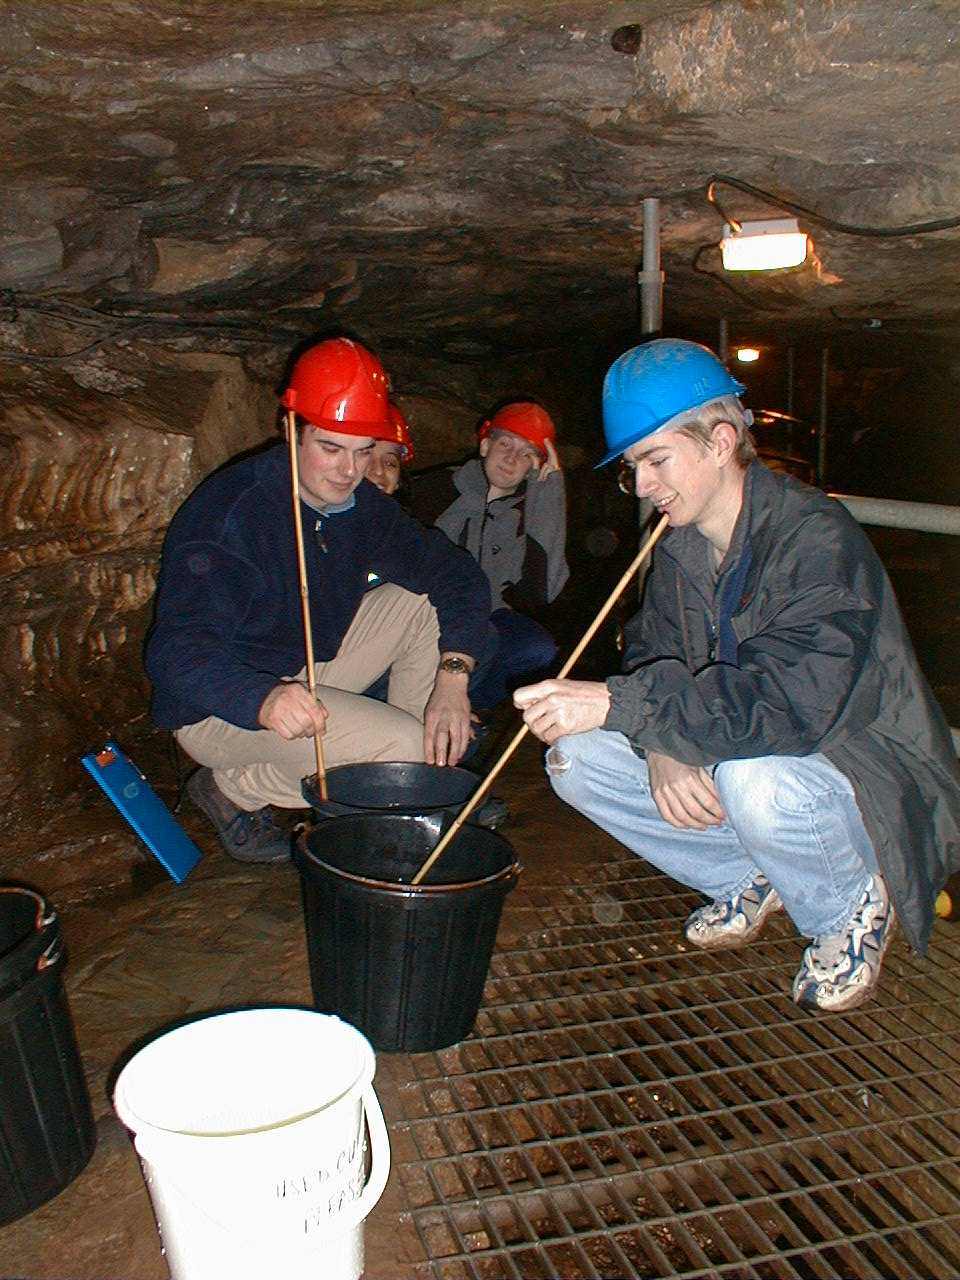
Figure 6.
To undertake the test, a person should inform the 'monitoring group', that the tracer has been prepared by the 'upstream group' and that they are ready for the gulp injection. Once this has been done, a member of the monitoring group should start the clock and inform the upstream group (using an air horn or a communication cable and light). As soon as this signal is received, the upstream group should pour rapidly, the tracer solutions into the main body of the channel flow. The monitoring group should record (on the worksheet) the channel conductivity every 30 seconds, until the values peak and then return to the background conductivity. To calculate the NaCl concentration (mg/l) from the conductivity measurements in the cave, multiply the conductivities (in mS/cm) of the stream-water (with diluted tracer concentrations) by an appropriate calibration factor. For White Scar Cave, this is approximately a factor of 0.7. These data can then be used within the worksheet (see below) to calculate the stream discharge
An example worksheet from gulp injection exercise To obtain a blank copy of this worksheet for your own use, click on the appropriate format below: Click on 'Stream discharge' to return to main page
| ||||||||||||||||||||||||||||||||||||||||||||||||||||||||||||||||||||||||||||||||||||||||
Dr. Nick A. Chappell |