|
|
ENV104 | ||||||
|
|
|
ENV104 | ||||||
|
|
STREAM DISCHARGE MEASUREMENTDr Nick A ChappellThe discharge of surface or underground streams (see field exercise) is an important environmental variable to measure for several key reasons. First, one can estimate drought-flows (also called 'lowflows') and flood frequency from a time-series of stream discharge. Second, the rate of evapo-transpiration from catchment vegetation can be estimated from the same time-series within a water-balance equation. Thirdly, the multiplication of a concentration of suspended-sediment or a solute with the stream discharge gives the mass of that suspended or dissolved constituent moved over time. Such calculations are important in erosion studies, nutrient budget estimation, and pollution studies. Stream discharge can be measured using (1) volumetric gauging, (2) float gauging, (3) current metering, (4) dilution gauging (constant injection or gulp methods), (5) structural methods, and (6) slope-area methods. The choice of method depends on the characteristics of the stream and on the application. (1) Volumetric gauging: Stream discharge (in cumecs) at one point in time (i.e., a 'spot discharge') can be measured directly with volumetric gauging, though this is only possible with small river-flows, or indirectly with the velocity-area methods of float gauging and current metering. (2) Float gauging: involves measuring the velocity of a neutral buoyancy object (e.g., orange or dog biscuit) and multiplying this by the average cross-sectional area (using a tape and rule) of the river. These objects do, however, float close to the river surface, which is faster then the average velocity of the water profile and must, therefore, be reduced by a coefficient (e.g., a river 0.9 m deep has a coefficient of 0.7). Some rivers also have large changes in velocity across the river channel. This cannot be corrected, so the more accurate current metering method is recommended. 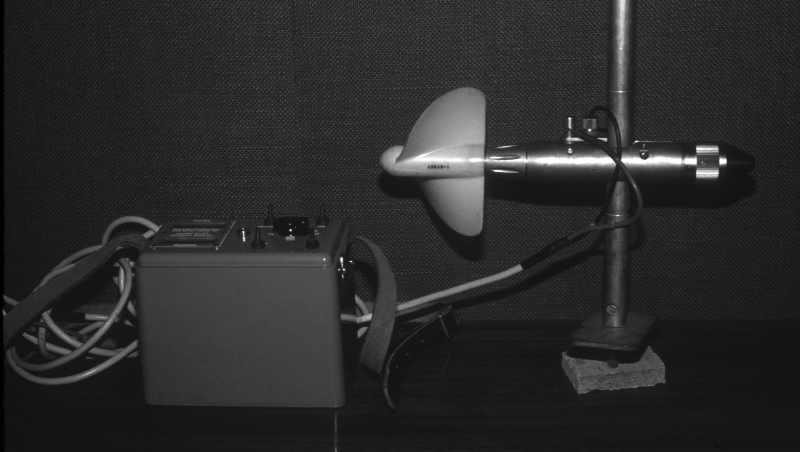
Figure 1. 'Braystoke' current meter and counter. (3) Current metering: With current metering the rotation of a current meter's impeller (Figure 1) gives the local water velocity following application of a calibration equation (called a rating equation). To cope with the vertical distribution of velocity, measurements should be made at different depths (D) in the water profile. If only two depths are used for measurement, then an average of 0.2D and 0.8D gives a good representation of the profile velocity, or 0.6D if only one depth is used (Hewlett, 1982 p99). The transverse (i.e., 'across-river') distribution of velocity can be characterised by first dividing the channel cross-section into a number of 'segments'. The edge of these segments are called 'verticals' and these are the locations at which the measurements to calculated the profile-average velocity should be made (Figure 2). The 'Mean-Section Method' or 'Mid-Section Method' can then be used to calculate the discharge for each segment (Dingman, 1993 p536-541). 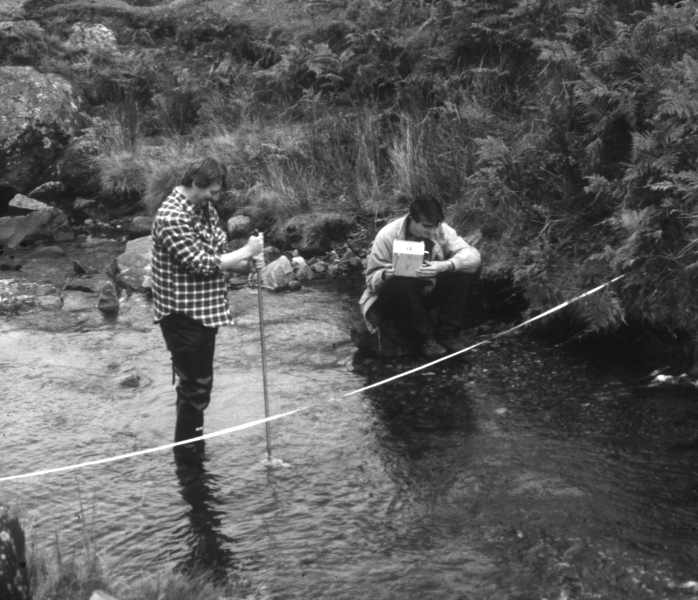
Figure 2. Gauging water velocity at a 'vertical' Where the �Mean-Section Method� is used to calculate discharge for each segment using: Qseg = 0.5(v1+v2) ´ 0.5(d1+d2) ´bwhere Qseg is the discharge for each channel segment (cumecs), v1 and v2 are the profile-average water velocities at vertical 1 and 2 respectively (either side of the segment), d1 and d2 are the depths of the flow at verticals 1 and 2 respectively, and b is the chosen width of each channel segment. The average velocity of the water in the two 'end segments' (adjacent to the river banks) are calculated by assuming zero depth and zero velocity at the water's edge. Current metering is an accurate method of river gauging except where the river is very shallow. Under such conditions, an alternative method of dilution gauging can be used. (4) Dilution gauging: This method is based on 'the two component mixing equation', i.e.,
where Q is the unknown upstream river discharge, q is the tracer discharge, C2 is the mixed downstream concentration, C1 is the concentration of the tracer to be added, and C0 is the background tracer concentration in the river (may be zero). Sodium chloride (common salt) is a good tracer for dilution gauging as it is (a) 'chemically conservative', i.e., does not adsorb ('chemically bind') onto river sediments, (b) has a high solubility in water, (c) is relatively non-toxic, (d) can be measured in the field indirectly with a conductivity meter, and (e) is cheap and readily available. Where large rivers are to be gauged, then alternative tracers that can be traced at ppb (part per billion) levels are normally used, e.g., the fluorescent Rhodamine WT. Two approaches to dilution gauging can be used - 'constant injection method' and the 'integration or gulp injection method'. The (3a) constant injection method is the most difficult to employ in the field, but the simplest to understand as it involves a direct transformation of the two component mixing equation, i.e.,
With this method a known tracer concentration (C1) is trickled into the river at a fixed rate (q; using a 'Mariotte device'). At a downstream point, the background concentration (C0) is measured followed by this concentration mixed with the tracer (C2). In some contrast, the (3b) integration or gulp method involves the addition of a known volume and concentration of a tracer (i.e., the VC1 term) into the river as a single 'slug'. The downstream (mixed) concentration is then measured (C2), the background concentration (C0) subtracted and the area beneath C2-C0 versus time (t) curve calculated giving the term:
The river discharge is then:
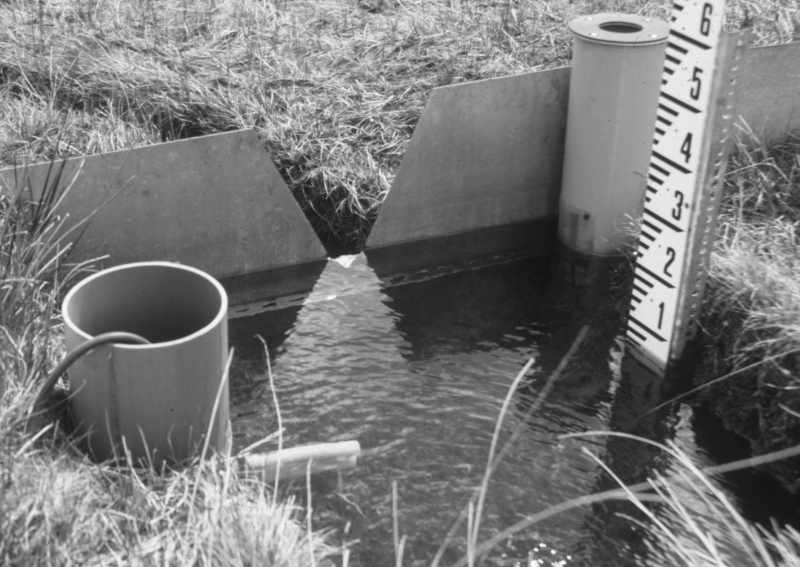
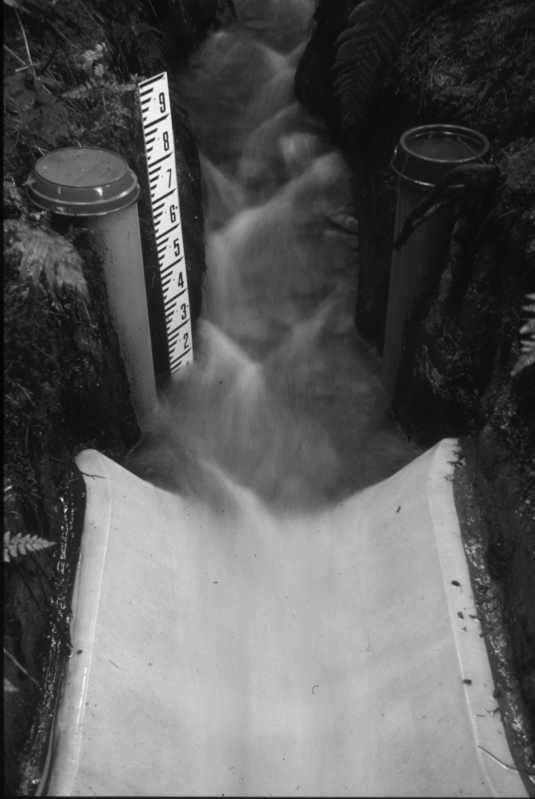
These four methods of volumetric, float, current-meter and dilution gauging (see e.g., Dingman, 1993 p541-542) give only spot discharges, for continuous traces of river discharge (e.g., a single river hydrograph or a series of several storm hydrographs), the structural method is required. (5) Structural method: Within this method, a relationship between the height of water in the river (called the 'stage') and several spot discharge measurements (by current metering or dilution gauging) is established and called the rating curve. Within a natural river reach the relationship between the stage and discharge follows many different curves, changing because the river changes from subcritical flow (also called 'tranquil' flow with a Froude number <1) to supercritical flow (or 'fast/shooting' flow with a Froude number >1). For example, as river-water flows over a boulder it moves from subcritical flow to supercritical flow (a 'hydraulic drop') at the top of the boulder and then 'jumps back up' to subcritical flow shortly after (at the 'hydraulic jump') (Gordon et al., 1992). If, however, one forces a river through a stable and large hydraulic drop, then just upstream of that point, that river is always subcritical and, therefore, has only one relationship between stage and discharge. Thus by building a structure to create this hydraulic drop an accurate discharge trace can be calculated. River gauging structures called weirs force the river generate this hydraulic drop as the water falls from a stilling pool, while flumes normally use a constriction to generate the hydraulic drop. There are many types of weirs from V-notch (Figure 3) to rectangular thin-plate to Crump weirs, and many types of flumes from trapezoidal (Figure 4) to H-flume types.
The river stage upstream of the weir and upstream or within a flume is then measured in a stilling well using a float-actuated chart recorder, an electronic potentiometer or electronic pressure transducer (and datalogger). If the peak discharge during a flood is required for flood prediction at a site where only the maximum height of the flood is known or where river-gauges have been over-topped, then slope-area methods can be used. (6) Slope-area methods: Perhaps the most common slope-area method involves the use of the Manning Equation, i.e.,
and
where V is the river velocity (or 'specific discharge'), R is the 'hydraulic radius' which is the cross-sectional area of the flow divided by the wetted perimeter, S is approximated by the downstream slope on the river surface, and n is Manning's roughness coefficient (which varies between 0.025 and 0.07 in natural channels). In other words, if the water-surface slope and the 'hydraulic mean depth' (» 'hydraulic radius') increase so does the river's velocity, while if the channel roughness increases, the river velocity reduces (Hewlett, 1982 p102-103). ReferencesHewlett, J.D. 1982. Principles of Forest Hydrology, The University of Georgia Press.Dingman, S.L. 1994. Physical Hydrology. Macmillan, New York. pp575.
|
Dr. Nick A. Chappell <N.Chappell@lancaster.ac.uk> |